Case Study - From Inverter to Impact: Engineering a Continental Solar-Data Platform
A production data platform that unifies 15 inverter ecosystems, processes global solar irradiance in C++, and surfaces fleet carbon impact and O&M health across 24,350 solar plants.
- Client
- Decarb.Earth
- Year
- Service
- Data Engineering, Geospatial Processing, Analytics Dashboards
- Solar plants monitored
- 24,350
- Inverter platforms unified
- 15
- Irradiance cells processed
- 16,200
- Client projects
- 44
Impact
Decarb.Earth exists to quantify the real-world climate impact of solar installations across Africa and the Middle East. I built and own the data platform underneath that mission: one pipeline that pulls raw telemetry from fifteen different inverter ecosystems, processes global solar-irradiance geography in C++, and surfaces both a public impact map and an internal fleet-operations dashboard covering 24,350 plants across 44 projects.
The through-line is deliberately end-to-end, running from a single inverter reading to an audit-ready statement of carbon displaced. Each stage is engineered as production software rather than a notebook: a typed Go service, a C++ geospatial engine, and a warehouse-backed analytics layer.
Ingest: one Go pipeline for fifteen inverter ecosystems
Every solar installation reports through a different manufacturer’s cloud, each with its own auth scheme, pagination, rate limits and quirks. I consolidated all of them into a single Go 1.26 command-line service that unifies fifteen inverter-vendor connectors (SunSynk, Solarman, Huawei, Solis, SolarEdge, Victron and more) behind one pluggable connector interface.
The service reads project metadata and encrypted API credentials from MongoDB and lands normalised time-series into MotherDuck, DuckDB’s cloud warehouse, using DuckDB’s columnar Appender for batch writes rather than row-by-row inserts. The largest ecosystem, Solarman, is ingested through a seven-worker fan-out over roughly 16,600 plants, with token-bucket rate limiting, exponential backoff, and per-plant-per-month resumable state so a mid-run failure resumes exactly where it stopped.
Because MotherDuck is single-writer at the storage layer, writes are serialised through a mutex while reads stay concurrent, and connections are recycled on a fixed lifetime to pre-empt gRPC disconnects on long runs. Downstream, a carbon-vintage assignment step turns validated energy into the tonnage figures that back the impact claims.
The inverter OEM clouds and energy-management platforms unified behind that one connector interface include:













- Go
- MongoDB
- MotherDuck / DuckDB
Process: global solar irradiance, clipped in C++
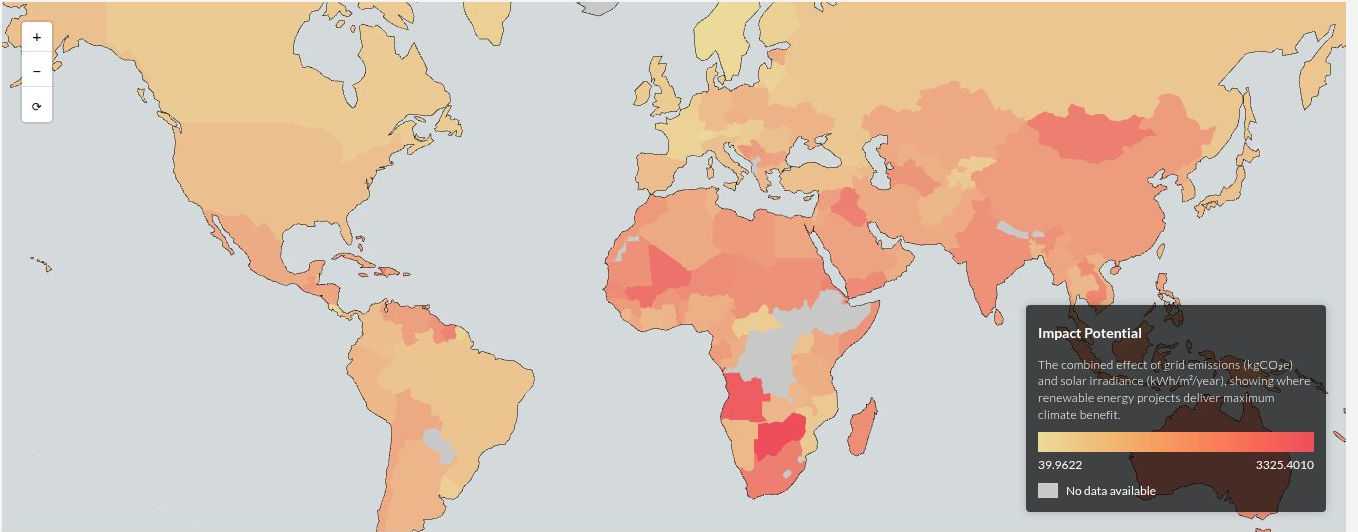
An installation’s climate value depends on where it sits: how sunny the location is, and how dirty the grid it displaces. To compute that at global scale I wrote a C++17 geospatial engine that clips a worldwide solar-irradiance grid of 16,200 cells at 2°×2° resolution against 195 national boundaries using Clipper2 with fixed-point integer arithmetic for precision, aggregating down to 254 per-country features.
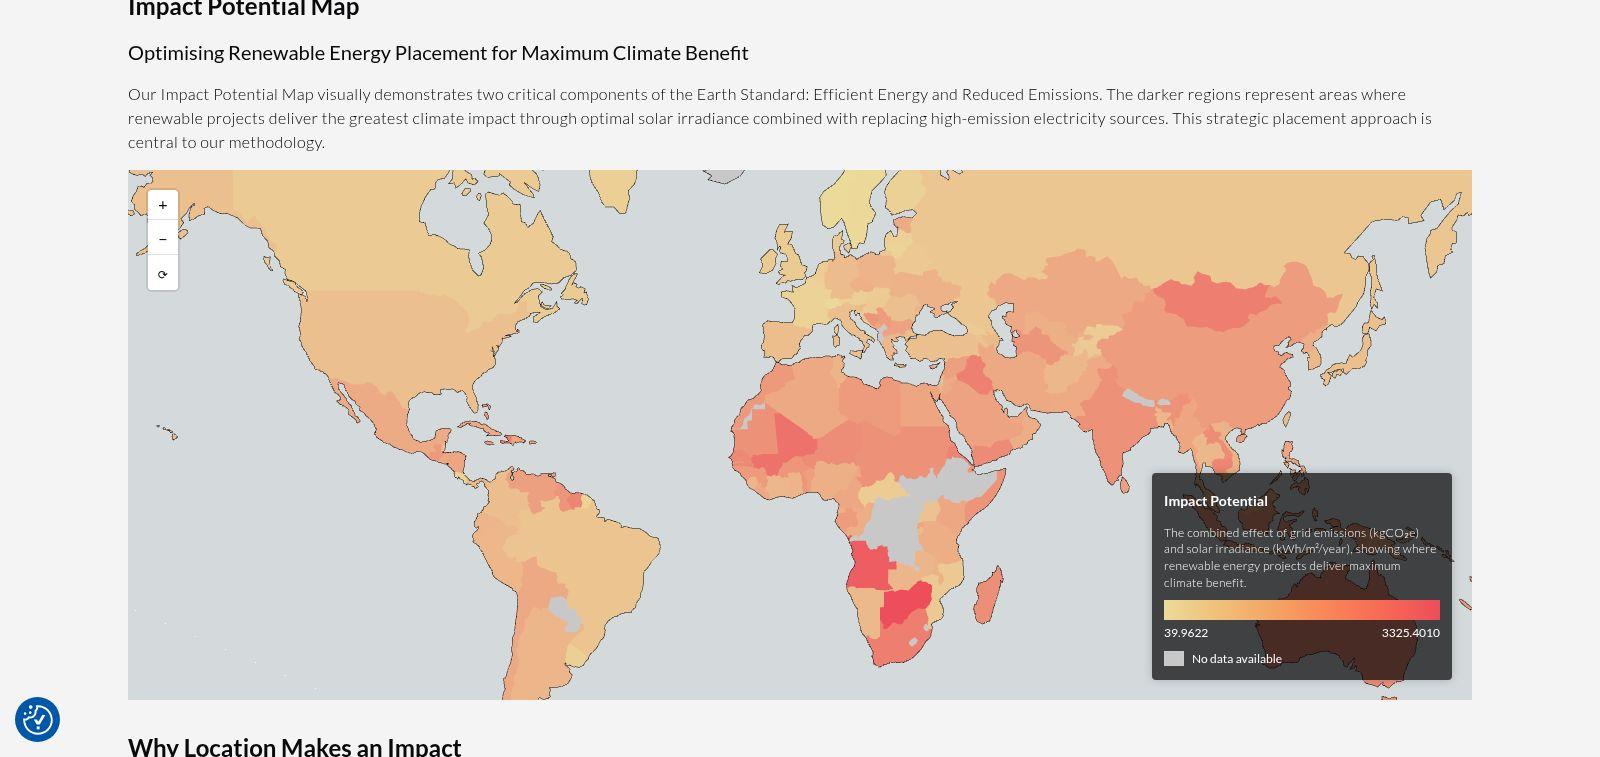
The engine ingests and emits GeoJSON and GeoPackage, so its output drops straight into QGIS for inspection, and a Julia enrichment step joins grid-emission factors onto each country before the data reaches the web layer. The result is the country-level “impact potential” surface that the public map renders.
- C++17
- Clipper2
- QGIS
- Julia
Surface: a live impact map and a fleet O&M dashboard
The processed geography drives a public Impact Potential Map built with deck.gl 9 on MapLibre inside a Next.js 16 app (App Router, Turbopack, Apollo GraphQL, deployed on AWS via SST in the af-south-1 region), alongside a tCO₂e calculator. A dual-layer GeoJSON render keeps the base map non-interactive for performance while the data layer stays pickable for hover detail.
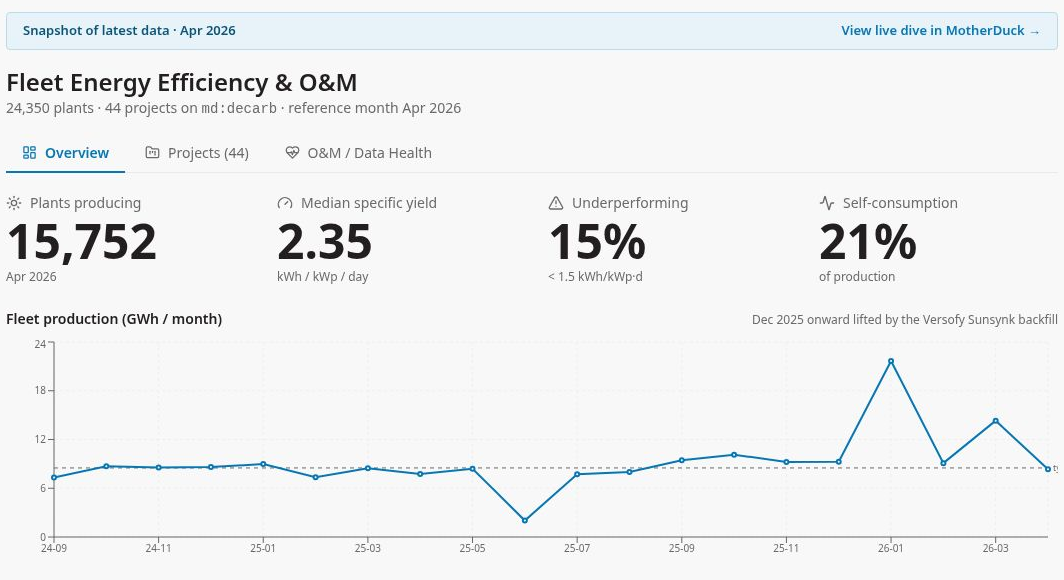
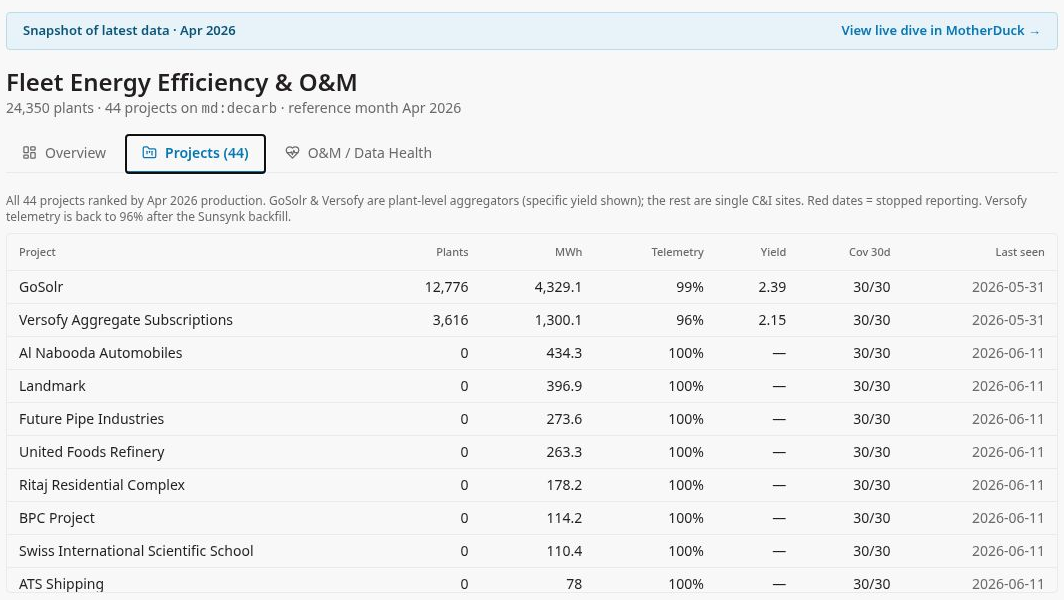
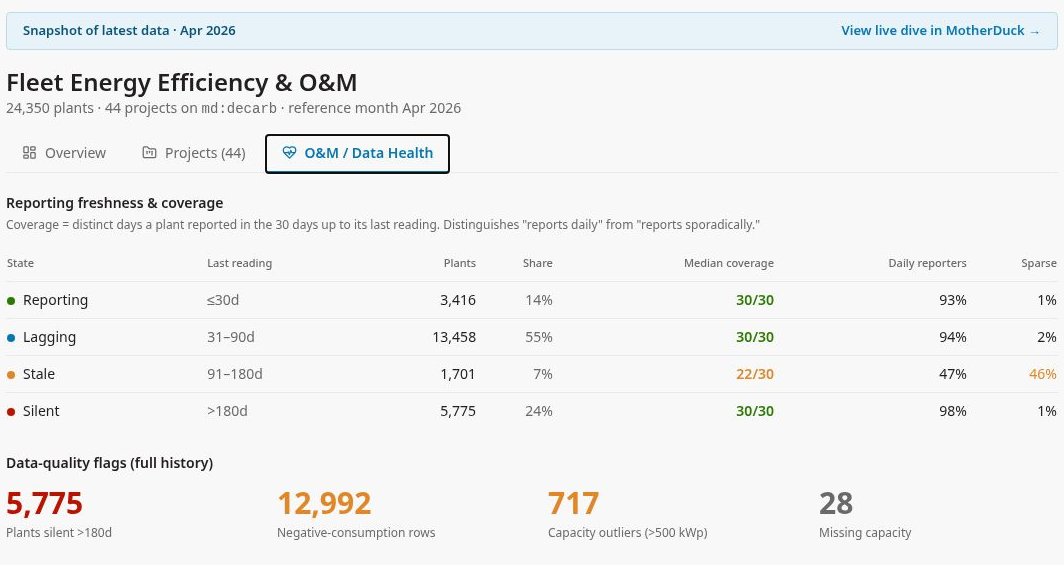
Internally, the same warehouse powers a fleet energy-efficiency and O&M dashboard I prototyped directly against a MotherDuck dive over 24,350 plants and 44 projects. Beyond headline production, it earns its keep as a data-quality instrument: it surfaces 5,775 plants that have gone silent for more than 180 days, 12,992 negative-consumption rows, and 717 capacity outliers. That operational signal is what keeps the carbon numbers honest.
- Next.js
- deck.gl
- GraphQL
- MotherDuck
About Decarb.Earth
Decarb.Earth is an energy-tech company building a credible standard for solar impact that pairs renewable generation with registry-grade carbon accounting. The platform ingests from installers and asset managers across Africa and the Middle East, including:







Challenge
The hard problems were rarely the happy path. Several vendor ecosystems expose no real API, so ingestion meant reverse-engineering portal endpoints and their auth and pagination behaviour, then hardening them against rate limits and partial failure. The warehouse’s single-writer constraint had to be reconciled with high-throughput concurrent ingestion. Global polygon clipping had to stay numerically stable across 16,200 cells and 195 boundaries. And all fifteen vendor integrations had to live behind one interface in a single binary, so that adding the sixteenth is a small, well-bounded change rather than a rewrite.